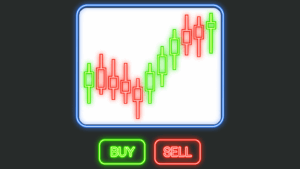
When I first looked at candlestick charts, they honestly felt like hieroglyphics. Green bars, red bars, wicks pointing up and down—I had no idea what they were trying to tell me. I remember thinking, “How can people actually trade using this mess?”
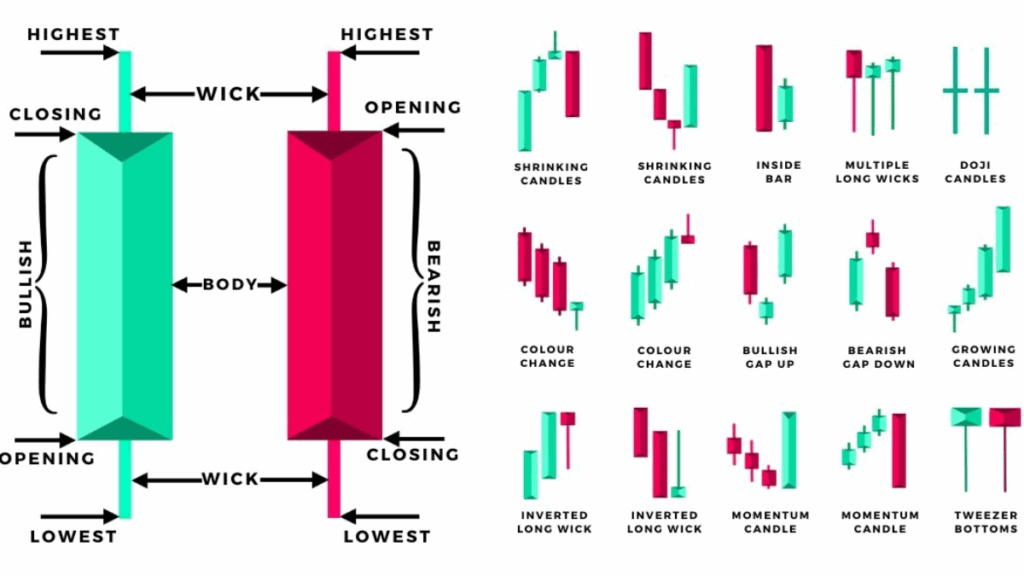
My turning point came when I slowed down and learned what each candle represented: a battle between buyers and sellers. A long wick on the top meant sellers had pushed price down. A long wick on the bottom meant buyers had stepped in. Suddenly, the chart wasn’t random anymore—it was a story unfolding.

One moment that stuck with me was during an Ethereum trade. I saw a strong bullish candle followed by a doji (a candle with almost no body). Instead of rushing in, I paused and thought, “Wait, the buyers are losing momentum here.” The next candle confirmed the reversal, and I avoided what would have been a losing trade. That felt like a breakthrough.
Now, when I look at candlesticks, I don’t just see shapes—I see psychology. I see fear, greed, hesitation, conviction. And once you learn to read those emotions on the chart, you’re no longer just guessing.