When I first opened my trading platform, charts looked like alien landscapes—candles, lines, and colors everywhere. Honestly, I had no idea where to start.

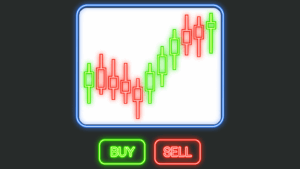
I began with the basics: candlesticks. One green candle, one red candle, one pattern at a time. I started noticing small things—how multiple candles formed trends, how price reacted at previous highs and lows, and how wicks often showed temporary rejections.
Next, I learned volume matters more than color. A bullish candle with tiny volume? Not convincing. A small candle with huge volume? That tells a story about market interest.
By practicing on historical charts and watching live markets, I slowly understood that charts aren’t just numbers—they are visual narratives of human behavior. Once you see them that way, trading becomes less scary and more intuitive.